
Clustering Using K-Means
Mar 09 2016
This semester, I’m taking a special topics course on data mining through the Tufts Math department. Up until now, we had primarily focused on the moderately complex math behind PCA analysis. However, we are starting to move onto look at new types of data analysis / clustering and today’s topic was k-means clustering. This sort of analysis deals with much less complex math (at least it does thus far) and from a CS student’s perspective, is much easier to rationalize. It’s a fairly simple algorithm and it does have some cool results.
For a brief explanation, the algorithm simply works by taking data (lets say n data points) and attempts to form them into k clusters (k is chosen by the user). k initial cluster centroids are picked (perhaps by random). From here, the following is done on every iteration:
- Assign each data point i to the “closest” cluster j based on its centroid (“closest” is defined here as smallest euclidean distance, but there are a number of different definitions)
- Once all data points are assigned, re-calculate the centroid of each cluster to be the mean of all of its now assigned data points
- Repeat until no improvement can be found
During lecture, my professor was showing us some plots from before and after clustering to visualize the k-means clustering process. I was intrigued and I thought it would be cool to see a step-by-step GIF of this process. Thus, I wrote some code in MATLAB to do k-means clustering and voilà, it works!
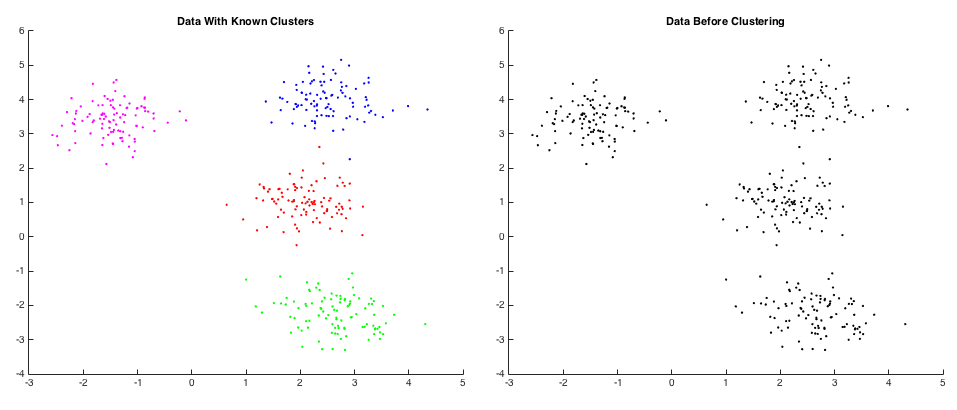
Initially, the code generates k normally-distributed random clusters of data of r data points each (kr = n total data points). These points are known to be in clusters by the user (we made it that way) but the computer doesn’t necessarily known that. For an example, see the two plots below. The plot on the left is colored according to the known clustering while the plot on the right is what is known by the computer - nothing.
The first iteration is done by making a random guess for the location of the k (four in this case) centroids. From here, we can follow the algorithm above until we converge on the answer. Generally, this convergence is approximately constant time (though theoretically it is linear) and so far I haven’t seen any examples that require more than 8 iterations. Below, you can see an example of the algorithm and the ultimate goal of this little project:
If you have any interest in playing around, you can find my MATLAB code here in a new GitHub repo for my data mining work. It should work for all reasonable values of k (clusters) and r (data points per cluster). I’ll be honest and say that my MATLAB code leaves a bit to be desired but it’s working so that’s mostly all that matters.
If you have any questions / comments, feel free to shoot me a message. I’ll follow up with any major changes / updates in the data mining world of Ben Tanen.