
Introducing 2016-17 NHL Projections
Oct 11 2016
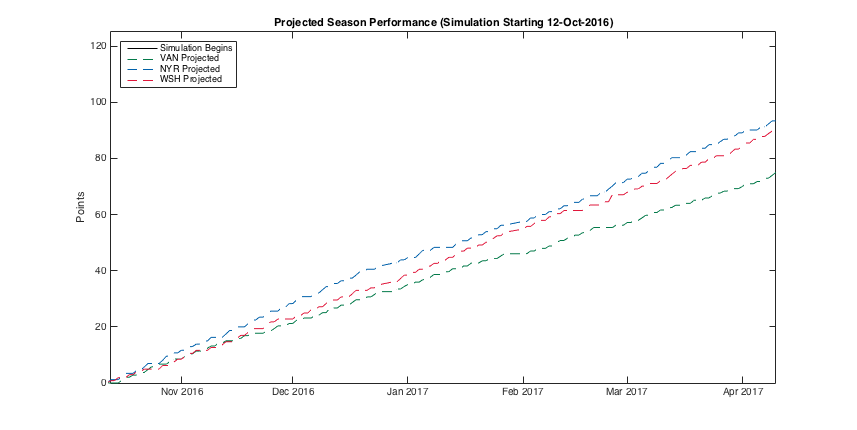
Last year as the 2015-16 NHL season came to a close, I built a fairly simplistic MATLAB model in an effort to (hopefully accurately) simulate the season. The model was built to take in some amount of past game data and use this to predict game-by-game performances over the entire season, resulting in season-long performances for each team. If you’re interested, you can read the original model report as well as check out the code.
Originally, this model was to be used in the early Spring (March / April 2016) simply to predict the last month or so of the 2015-16 regular season, but the model appeared to work fairly well going as far back as the first weeks of the season. Given this, I decided I would put my model to the test with the new 2016-17 NHL season (starting tomorrow!).
So, over the course of the next few months, I’ll be comparing each team’s expected performance (as speculated by the model) to their actual performance. I’ll also be tweaking the model and using it to run other predictions and analyses, just to see what I can come up with. For more on the project, as well as the most up-to-date projections, check out the new project site here.
For a little sneak peak, to start off the season, the model is only working with game data from the 2015-16 season and the handful of pre-season games so I don’t have the highest expectations for these predictions. See below for the top 8 projected teams, all of who (with the exception of Boston) made the playoffs last season.
| Team | Projected Points (2016-17) | Actual Points (2015-16) | |
|---|---|---|---|
 |
DAL | 96.31 | 109 |
 |
PIT | 95.53 | 104 |
 |
CHI | 94.76 | 103 |
 |
SJS | 94.06 | 98 |
 |
NYR | 93.33 | 101 |
 |
TBL | 93.24 | 97 |
 |
BOS | 92.53 | 93 |
 |
STL | 91.82 | 107 |
Here’s to an exciting 2016-17 season and #LGR!