Minimizing Risk For An Optimal Portfolio
Dec 12 2015
For an interview, I was recently assigned the task of determining the ideal optimized hedge ratio of a portfolio of 3 - 5 different equity instruments. I approached this by attempting to reduce the risk, which is generally measured as variance or volatility, of the portfolio (this theory / approach was further backed up by this paper).
The first step was to figure out which equities I would use in my fake portfolio. I knew I wanted low risk so I decided to use ETFs and through these, I attempted to capture some of counter-cyclical performance (have one equity perform well while another does not) which would also reduce risk. I simply did this by looking at the covariance between different ETFs and then picked the ETFs that had the smallest overall covariance. I think this method worked, but if I’m completely honest, I think this was the weakest part of my approach. There was so much more potential research / analysis I could have done on the equities that I was using and using different (better) instruments probably would have made a huge difference in terms of performance. But I went the simple route and focused on the weights of these instruments in said portfolio instead.
In order to reduce the risk of this fake portfolio of low variance ETFs, I used Markowitz’s modern portfolio theory to find the best weights to use for each equity. Essentially, Markowitz states that the optimized portfolio is a portfolio that lies along the “efficient frontier” (outer edge) of the Markowitz bullet (a plot of return vs. variance, examples seen below) where each point in the bullet is a different weight distribution of the same portfolio. In my situation, I wanted to reduce risk (variance) so I wanted a portfolio that would be at the left-most tip of the bullet.
I found this optimized weight allocation by looping over a bunch of different allocations and searching for optimized performance. First I looped through allocations in increments of 0.1 and then examined closer at the region(s) that performed the best. I repeated this process again with increments of 0.025 and 0.005 to find the best weighting. All of these trials can be seen in the bullets above, as well as the final optimized portfolio in red (at the tip).
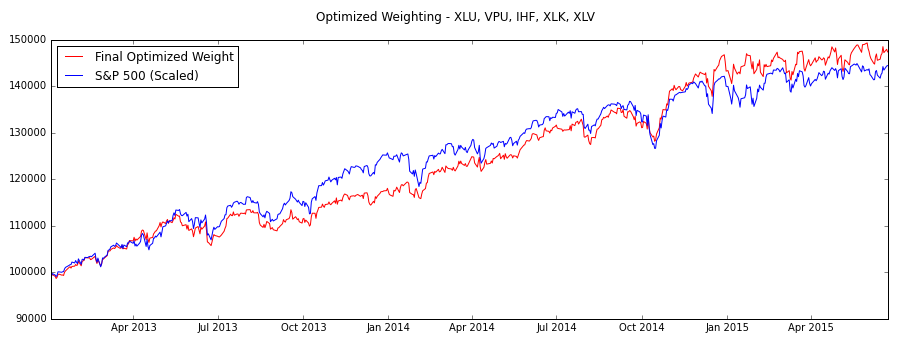
Overall, the optimization process went pretty well. The plots above show that the portfolio I found was indeed the lowest risk so I did optimize the hedge ratio (the goal of the assignment). When comparing this made-up portfolio to the S&P-500 over the same period, the optimized portfolio does slightly outperform the S&P, but not by much. This makes sense because with the reduction of risk, the portfolio also has reduced return so at the end of the day, this portfolio is really just a safe, not interesting bet.
For more detail and / or to look at the Python (using Pandas) code, you can check out the iPython notebook here.


