Am I Becoming More or Less Hipster?
Aug 26 2016
After years of using their services, I finally decided to check out Spotify’s Web API in preparation for some upcoming hackathons. I decided to poke around in some of the API’s data (after having previously used Last.FM’s data to visualize my Spotify usage) and I was intrigued by the “popularity” metric that Spotify served up for each song. While I’m not sure how exactly Spotify calculates this unit-less number, I imagine it has to do with the number of recent plays worldwide.
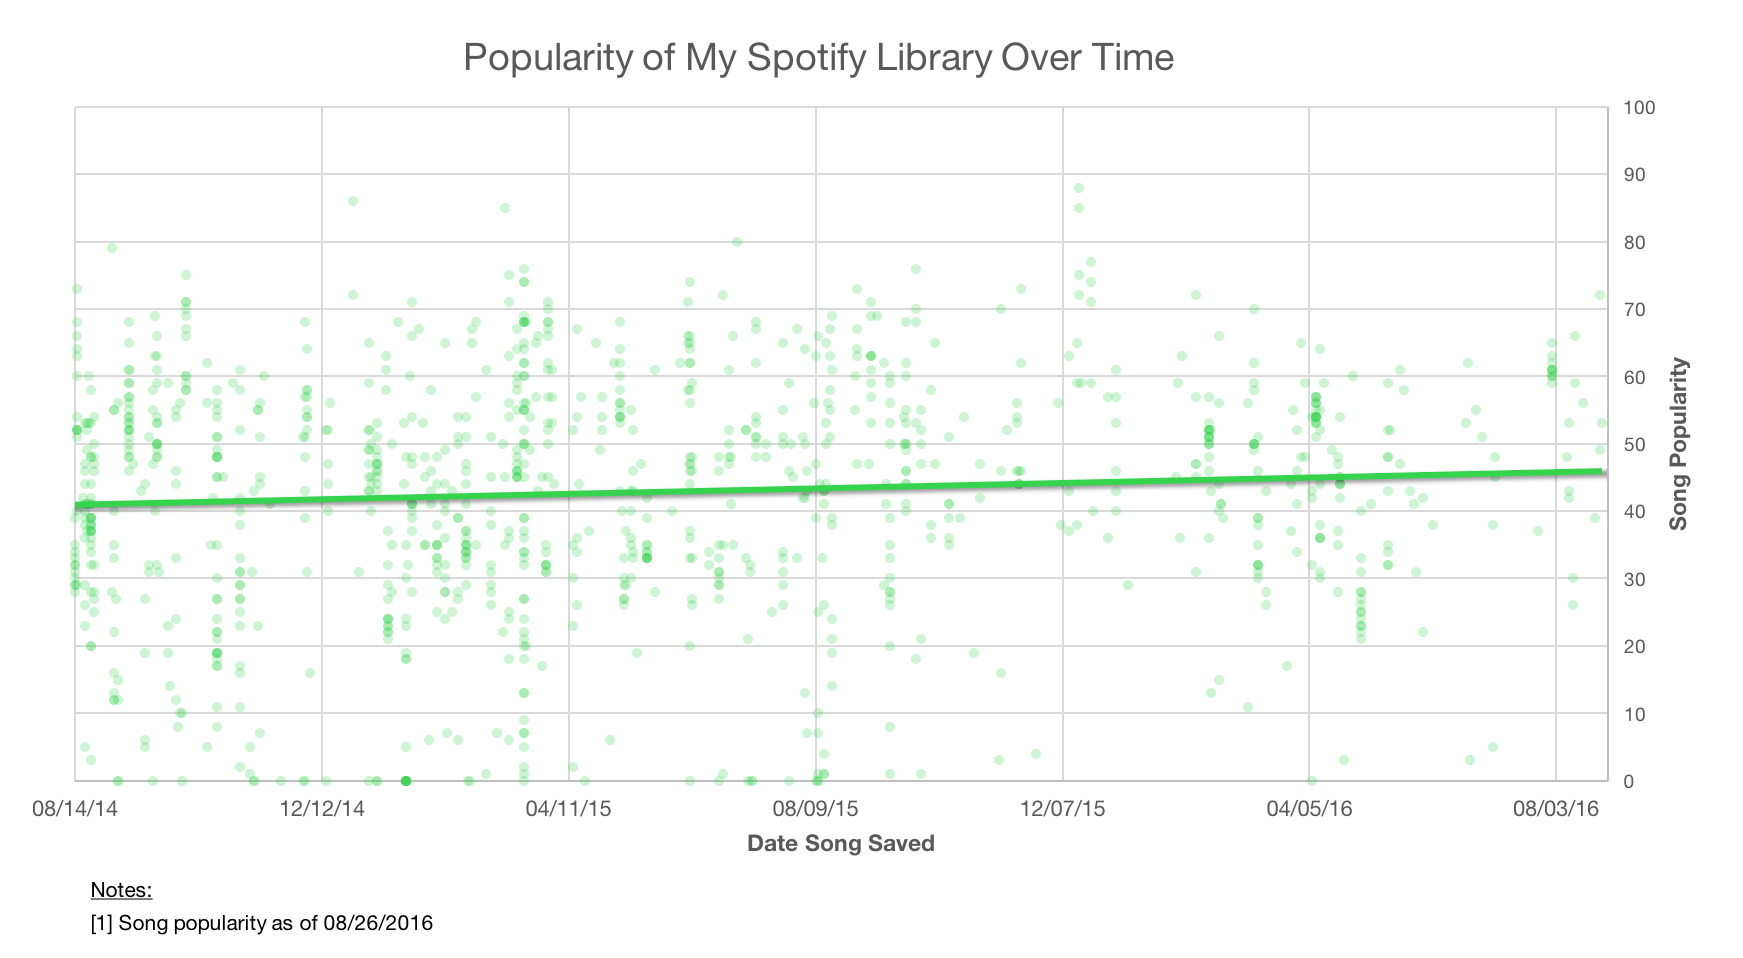
Out of curiosity, I decided to see how my Spotify library stacked up in terms of popularity. I was also curious to see if my more recent saved songs are more or less popular than my older saves (i.e. am I becoming more or less musically hipster). As a result, I got the chart below, where each of my saved songs is plotted based on when I saved the song versus the songs popularity (as of 08/26, not when I saved it).
While it does seem to stay relatively steady at an average of 42.1, the plot does seems to indicate a slight upward trend, perhaps as I lose my cool over time. However, I think a certain amount of this up-tick stems from the fact that more recently released music will likely be listened to more worldwide and thus be considered more popular in Spotify’s eyes. Therefore, I’m willing to bet most, if not all, of this trend is a result of my more recent saves being more recently released. This means I’m just as cool as ever.
P.S. Of my 1916 saved songs, only 20 had a popularity greater or equal to 75 while 302 had a popularity lesser or equal to 25. Just something to consider.
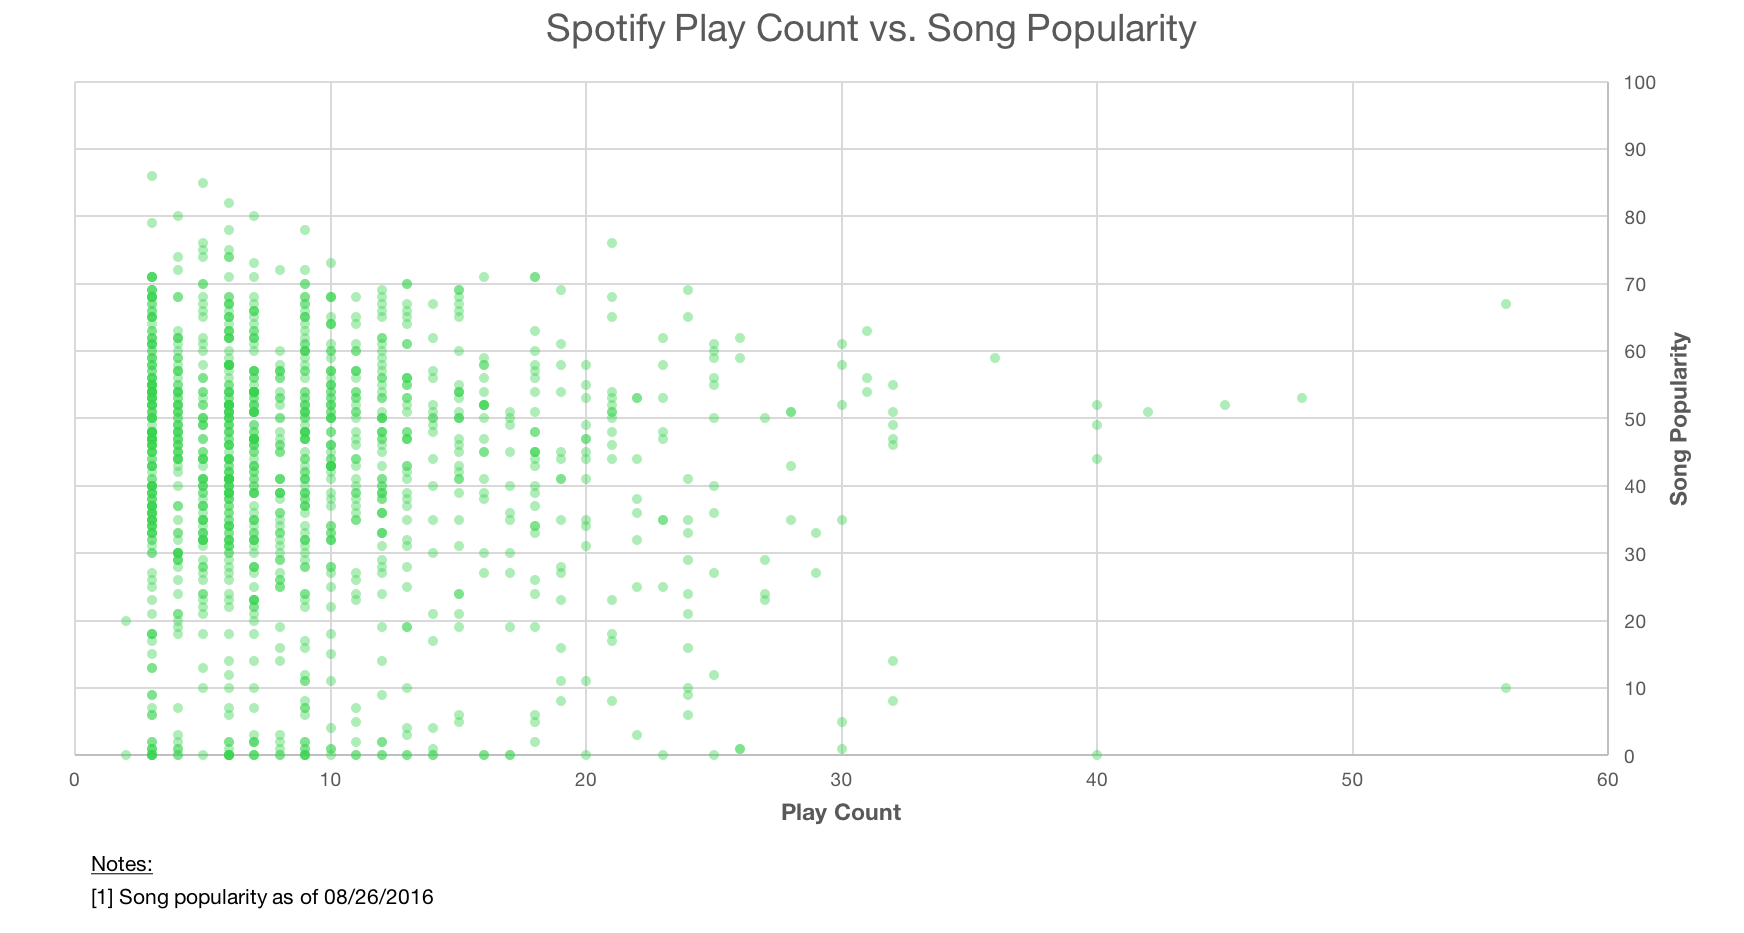
P.P.S Bonus chart! Here’s a chart of how much I listened to a song vs. it’s popularity on Spotify.


