Visualizing My Spotify History
Sep 01 2015
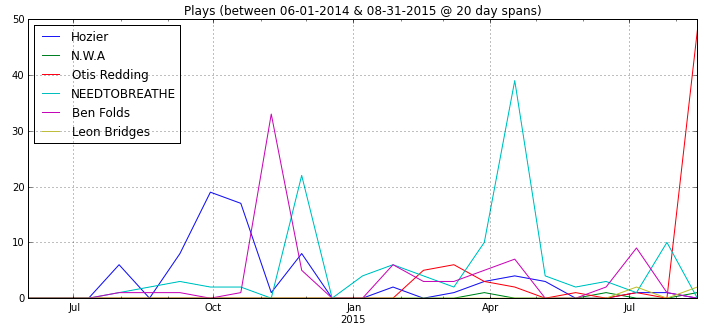
As most people do, I go through phases of musical interests. I’ll listen to one artist for a week and then switch to someone different the next. I thought it would be cool to visualize these phases and the shifts in my listening, you know, just for fun. So using Last.fm’s scrobbling data, this handy script, and some Python / pandas, I was able to see just what I was listening to over the past few years.
The process was pretty simple. Once I found the existing script (link above), I simply had to parse through the text, load it into a pandas DataFrame, and do some simple analysis. Knowing that, I plan on going a little deeper and seeing what cool stuff I can find.
Quick Note: This data only reflects my listening history on computer. For some reason Spotify Mobile is set to scrobble my listening history but is refusing to actually do so. Oh well…
For more, you can see the whole iPython notebook here (Hurray for iPython notebooks, they’re awesome).

