
Finding the Most Average Font
Jun 23 2019
In a previous post, I mentioned my fascination with generative art. One of my favorite creators of this art form is Zach Lieberman, who is constantly experimenting with different themes and methods for producing generative art. For a series he was working on near the end of 2018, he created drawings and animations to showcase the many different fonts on his computer. This included layering O’s from each font on top of one another, sorting I’s by their aspect ratio, and creating a three dimensional counting stack. These animations are a fascinating way to highlight the differences in the design of these different fonts, but when stacking them, we also see the similarities that make up a generally shared form across fonts. This makes sense, since typographers design fonts so that a reader will recognize that E in their font is in fact an E. This recognition is heavily driven by the existence of fundamental components of any given letter (e.g., the three arms in E, the two bowls in B). When many fonts are stacked on top of one another, we can see trends and standard conventions in which components are included as well as how. I decided to explore these trends and see which fonts most closely followed these conventions and which decided to resist them.
Note: This post will contain some font design lingo, so if you’re relatively new to typography (like I am), you can read some basics on these pages for background.
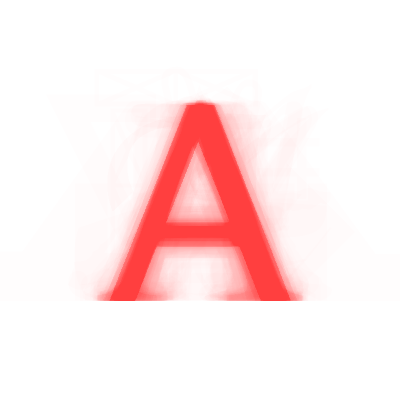
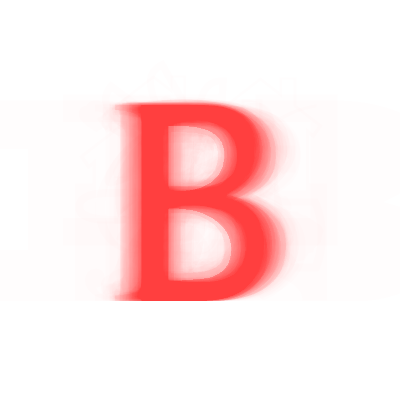
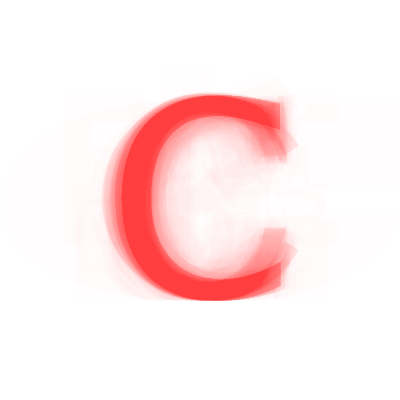
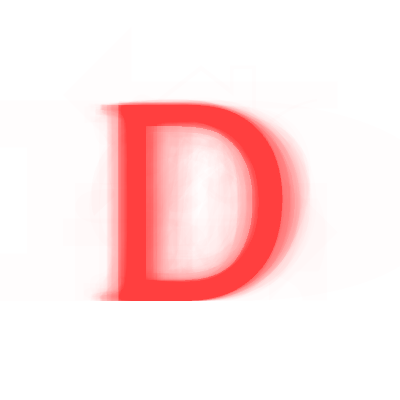
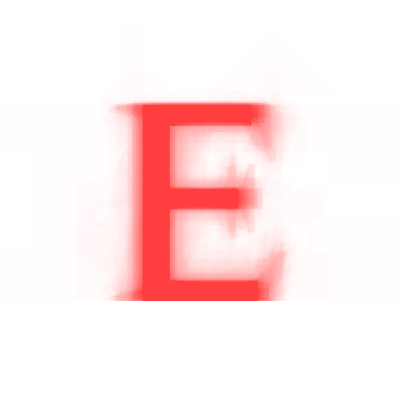
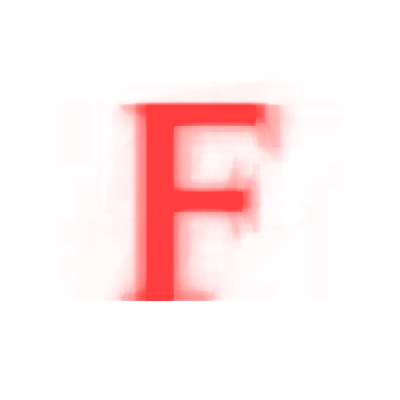
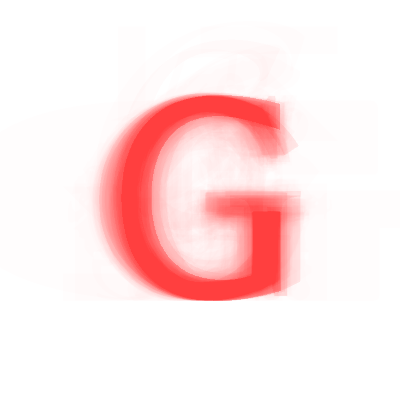
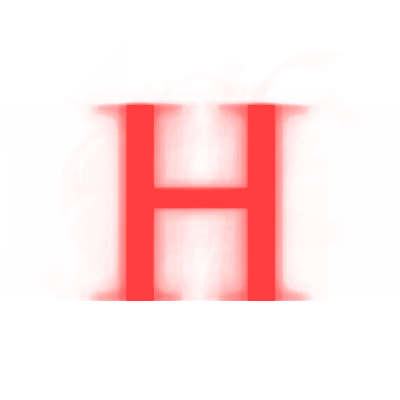
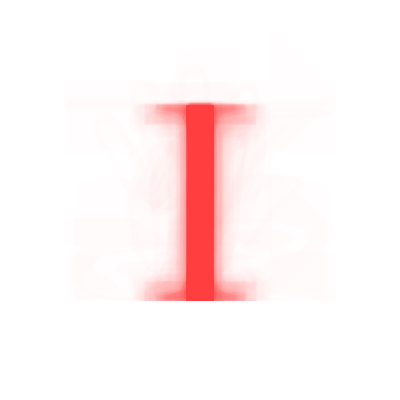
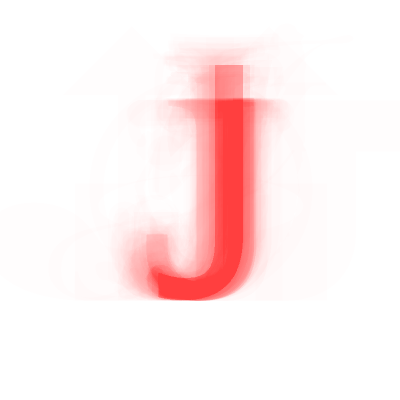
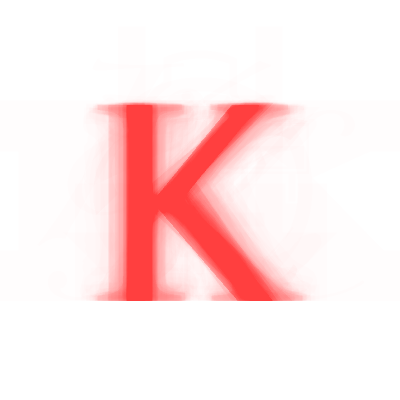
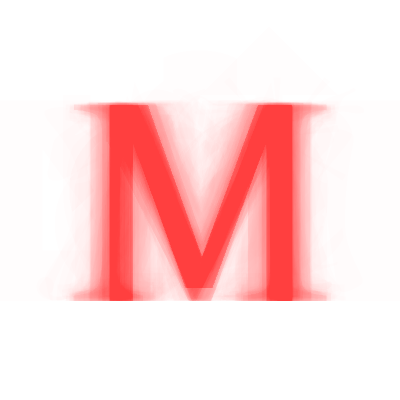
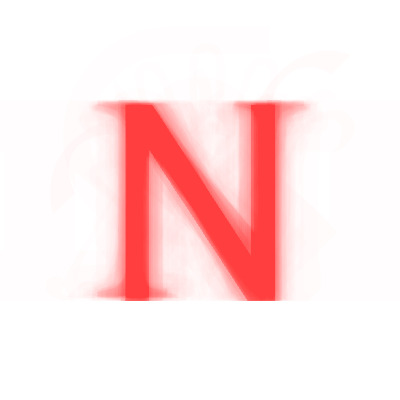
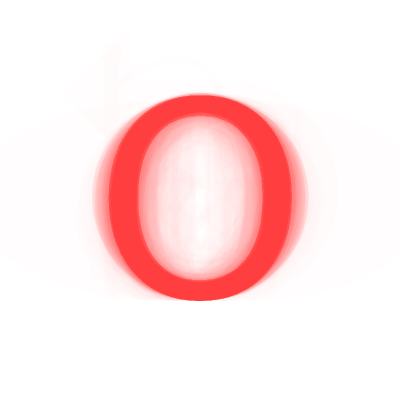
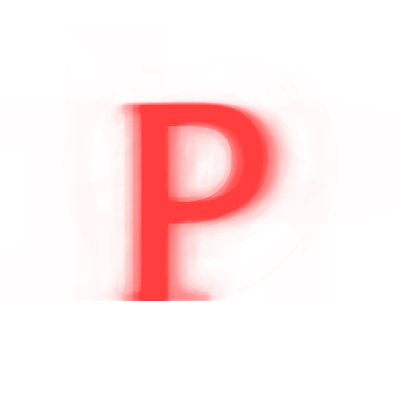
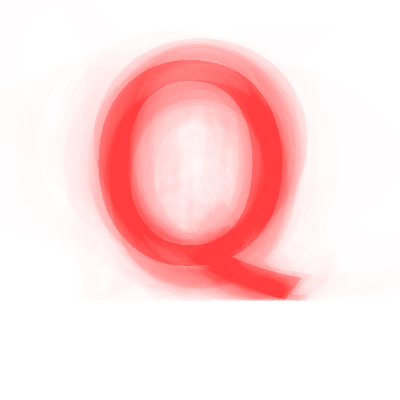
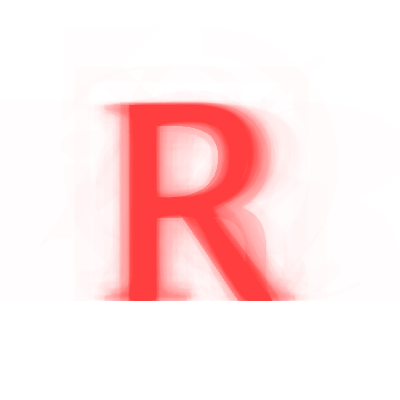
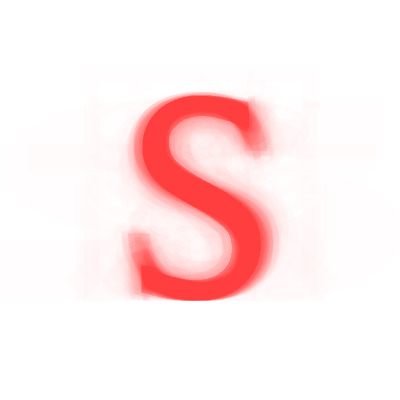
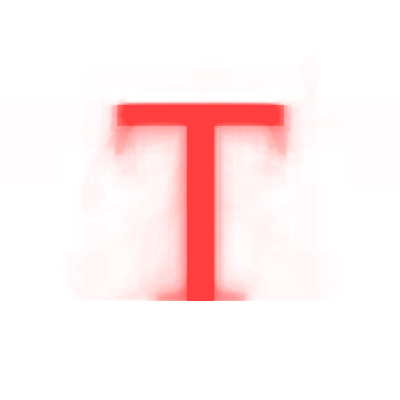
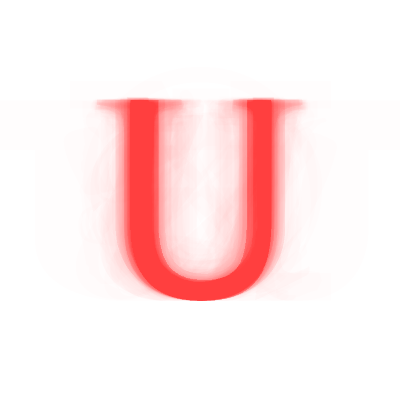
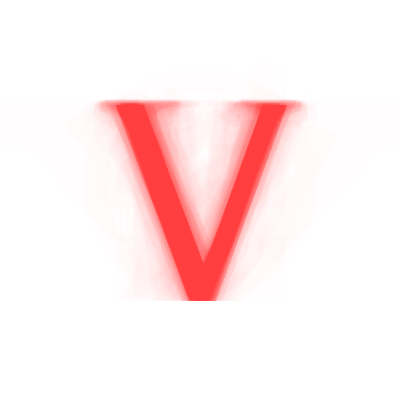
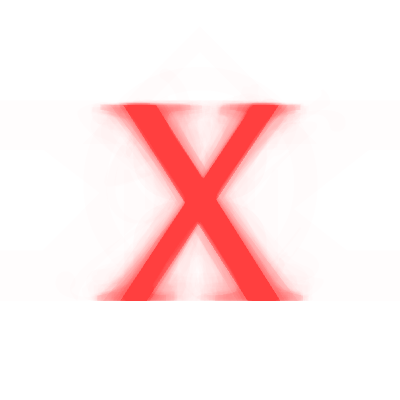
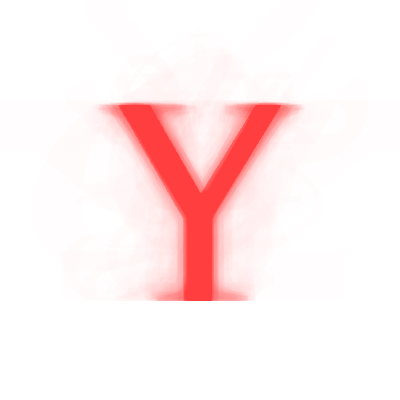
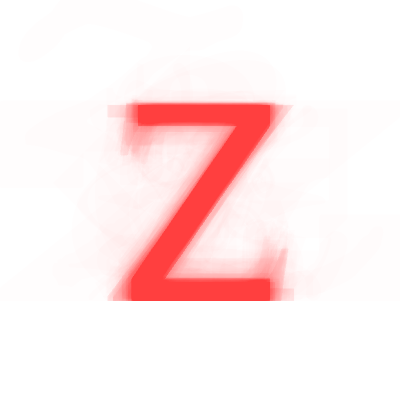
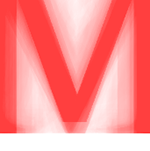
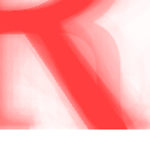
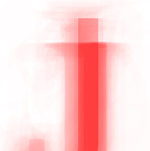
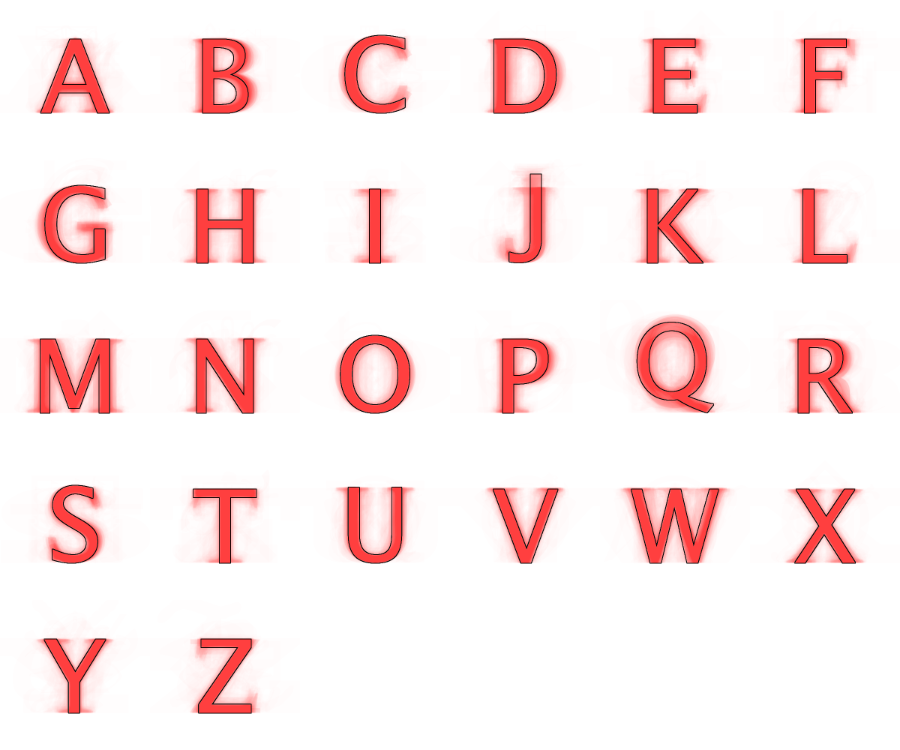
The first step was to generate some images to show the trends in font form for each letter. To do this, I stacked partially transparent text for each letter of each font on top of one another to generate a “heatmap” of where fonts overlapped and where they didn’t.


← Scroll →
Looking at these heatmaps, we can see obvious trends emerge that form the basis of the letters we know and love, i.e., the heatmap for C looks like a C. But looking closely at these images, we can see the different ways that fonts can vary. A more obvious and consistent example is the use of serifs. Based on the fonts I used for this exercise, about two thirds of fonts are sans-serif, but by focusing on caps of a particular letter’s strokes, we can see the faint apparition of serifs coming from those minority serif fonts. The inclusion of serifs is an intentional design decision and from these letter heatmaps, we can see the embodiment of this design choice. These design decisions are often made across an entire font, but there are also letter-specific examples.
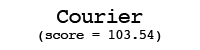
Beyond showing design decisions and trends across fonts and letters, we can also use these heatmaps as a benchmark to test how “average” an individual font might be. By layering an individual font’s letter on top of a heatmap and measuring the saturation of the color inside vs. outside of the font, we get a measure for how much that letter overlaps with the standard/average form, which I’ll refer to as it’s “averageness score.” If we then sort all of our fonts/letters based on this averageness score, we can see a series of fonts that start relatively average and then diverge quite a bit from the standard.
← Scroll →
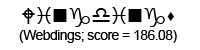
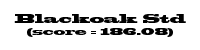
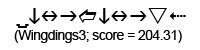
Using these individual letter averageness scores, we can assess how divergent and/or unique a particular font is by taking the average score across all 26 letters. After doing this for each font, we find that the most average font is… Lucida Grande! On the other end of the spectrum, we unsurprisingly see that a variant of Wingdings is the most unique font. Interestingly, the font Blackoak Std came in with the second lowest average, largely driven by how wide the letters of this font is. You can see these fonts (as well as a selection of extreme examples and other notable fonts) compared to the heatmaps by clicking below.


← Scroll →
Now that we’ve arrived at a quantitative assessment of the most and least average fonts, it’s worth considering what these measures actually say about a font or how we should use them. If you were to be working on an eye-catching project that were to call for an eye-catching font, it is possible that you might want a font with a lower averageness score. However, for many projects, while intentional, an included font is supposed to be unnoticeable. Does that mean we should be using fonts that lean towards the more average end of the spectrum? Maybe. More likely than not though, this idea of “averageness” is just another (important?) component of one’s greater considerations for a font choice. Just as there are hundreds of different choices that make up a design for a font, choosing the right font for a design often involves a number of questions. If one of those questions is “how ordinary should the font be,” you can now consult the data.
* * *
Methodology and minutia
All images and gifs were generated using a combination of Processing and ImageMagick.
The first iteration of this project included all of the 712 fonts on my computer, but I decided to pare it down to the primary/”regular” versions of each font (e.g., keeping Helvetica, but not Helvetica Oblique or Helvetica Light), leaving a total of 255 fonts. A handful of these fonts were also primarily designed for non-Latin alphabets (for example, Waseem was designed for Arabic), but since I was analyzing characters in the Latin alphabet, Processing often displayed these fonts using standard fonts.
When initially generating letter heatmaps, Processing would frequently render fonts at inconsistent sizes and with inconsistent offsets/positions. As much as font sizes are supposed to be standardized to describe a font’s height in pixels, not all fonts at centered 100 pixels will actually render centered with a height of 100 pixels (some will be taller/shorter, some will have padding, etc.). To compensate for this, I calculated the bounding box around each font/letter combination and used the dimensions of these bounding boxes to scale and translate everything back to the center at the intended height.
You can find all of the code, data, and generated images from the project in this repo.
Interestingly, in a response describing the high or low vertex, the responder captured the essence of most of these design decisions: That’s just one of hundreds of type design decisions with endless amounts of gradual options.
See the methodology section below.