
Is IBM Watson Good At Fantasy Football?
Jan 08 2020
In the years since IBM’s Watson supercomputer infamously appeared on Jeopardy! in 2011, Watson has become a household name and one of the most well-known examples of artificial intelligence in the real world. Much of this fame has come from IBM’s continued marketing that integrates and showcases Watson in a variety of real-world applications. An example is IBM’s recent partnership with ESPN to bring Watson’s AI capabilities to ESPN’s fantasy football system in the form of player-by-player performance projections. Per IBM’s marketing materials for the project, Watson was trained to predict weekly scoring ranges for players to indicate their upsides and downsides as well as the projected likelihood that a player will exceed or fall below these thresholds. These projections are shown to fantasy football players when viewing a specific athlete’s stats and are also frequently used in discussions on ESPN’s fantasy-driven shows.
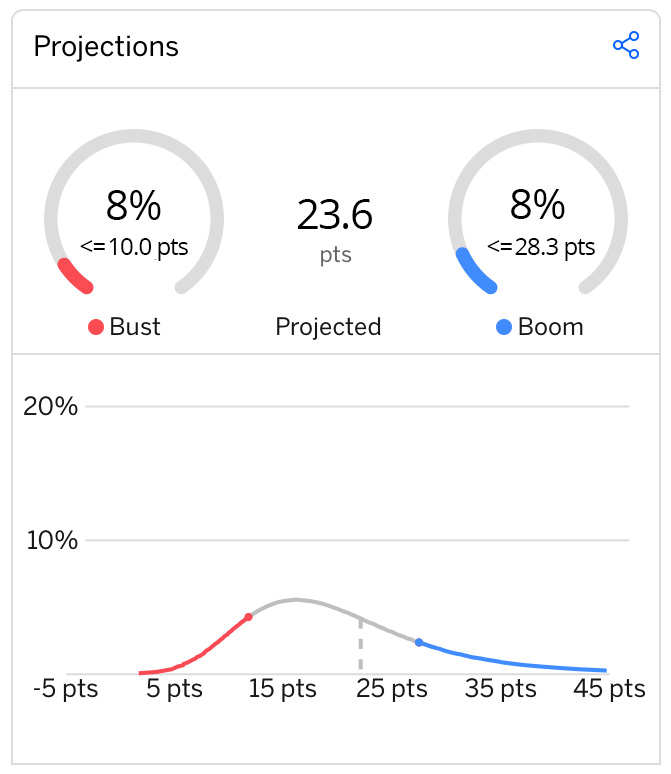
For the 2019 season, Watson made projections for hundreds of players across 17 weeks, which amounts to thousands of distinct player projections. For each projection, a player is given two point thresholds (an upside or "boom" threshold and a downside or "bust" threshold) that indicate how strong of a week Watson projects for that player. Watson also assigns probabilities for these thresholds and the overall likelihood of a player having a good or bad week. For example, in week 5, Watson gave Patrick Mahomes a boom threshold of 28.3 points and a bust threshold of 10.0 points, where each had an 8% chance of occurring. This means that, based on Watson's projections, Mahomes had an 8% chance of having a great week (scoring 28.3 or more points), an 8% chance of having a bad week (scoring 10 or fewer points), and 84% chance of scoring somewhere in between - he ultimately went on to score 18.5 points.
IBM and ESPN have described these projections as a way for fantasy football players to quickly gain insights and another tool for players to use when making game-time decisions. However, after a few seasons of the partnership, there is still relatively little information on the overall accuracy of these projections. IBM has said that Watson helped an IBM data scientist go undefeated in fantasy football, but this is one example and is obviously from a somewhat biased perspective. Thus, inspired by a recent project from FiveThirtyEight, I decided to find out for myself.
Using all of Watson’s projections, we can assess Watson’s accuracy by measuring how well calibrated its predictions are. In this context, calibration is a measure of how accurately Watson’s predicts align with the real-world results of what it predicted. For example, if, over the course of the season, Watson made 100 projections that have a 40% chance of occurring and 40 of them were correct, we would say that the model is well-calibrated. However, if instead 70% of these predictions were correct, we would say that Watson is poorly calibrated. This is because the forecasted likelihood of these projections (40% chance) were inconsistent with the actual likelihood for which they occurred (70% chance).
We can therefore measure Watson’s overall calibration by bucketing thousands of its projections based on their predicted chance and then test how often those projections actually occurred. If we plot this, we would expect a perfectly calibrated model to follow the dotted diagonal line, while a poorly calibrated model would diverge from this line at different points. By this measure, this year’s data would indicate that Watson is doing so-so. Each dot in the plot below represents a group of projections and for the most part, these points somewhat correlate with the trend we would expect for a perfectly calibrated model, though it’s clear Watson has been far from perfect.
Forecasted vs. actual probabilities for IBM Watson + ESPN fantasy football projections
Bucket size:
It is worth noting the importance of sample size when we talk about calibration. If a model makes 100,000 projections with a likelihood of 20% and 20% of these projections are correct, it is fair to say that the model is well-calibrated. However, if a model makes five similar projections (all with a 20% chance of occurring) and two of them (40%) are correct, we should hesitate from calling the model poorly calibrated. This measure of calibration, like all things in statistics, follows the law of large numbers so there is always a possibility of irregular outcomes with smaller sample sizes. Thus, we should note that the dots/buckets that appear the furthest from perfectly calibrated are often associated with groups with relatively fewer projections. To play around with this, you can change the size of the buckets above, which will change the range of projections included in a particular bucket (e.g., when n = 2, all projections between 25 - 27% are grouped together; when n = 10, all projections between 25 - 35% are grouped together).
Given all of this, it is worth asking: is this a good use of Watson? From a strictly data science perspective, Watson has done a fine but not great job. The projections are not disastrously bad but they are probably not much better than what a well-informed human would say. To be fair, it is incredibly difficult to predict the performance of individual players with any real sense of accuracy. There are so many convoluted factors that can lead to a successful game for a particular athlete, more than even Watson’s mighty powers might be able to entirely understand.
However, as much as Watson and its applications are depicted as data science projects, I don’t think IBM assesses Watson’s success from a data science perspective. Instead, by all reasonable accounts, Watson is actually a very expensive marketing tool. Watson’s work with ESPN never appears to be marketed as the next great tool for fantasy football players to dominate in leagues but rather as the next great tool that ESPN could use to keep users engaged. Watson’s success is likely not measured by its calibration or accuracy, but rather how much money it can make for ESPN and how many new clients it can bring in for IBM. Watson has certainly developed the capabilities to do some remarkable things - beating Ken Jennings is no laughing matter - but more than anything, Watson’s work at ESPN serves as a shiny example of all the things that other business could potentially accomplish if they pay lots of money to IBM.
* * *
Methodology and minutia
IBM Watson’s weekly player projections were scraped from ESPN for weeks 1 - 16 of the 2019 season. ESPN did not report projections for all players in all weeks, both when the player was not likely to play or when the player did not have enough relevant data available to make a projection. If the player had no projection for week 16, it was not possible to view Watson’s projections for the player in prior weeks, so these data are not reflected. In total, 2930 player-weeks of data were used, where each player-week had three projections, resulting in 8790 total projections assessed.
You can view the full list of projections used here. Watson’s point projections reflect PPR scoring.